Math can be beautiful. One of the mathematical things that has always intrigued me has been the visualization of the Mandelbrot set. I never tried to generate it myself until just recently. The only understanding I had previously of the Mandelbrot set was vague. I looked for some explanation on how to do the computation, but I couldn’t find an adequately succinct explanation. My brother helped me take the Mandelbrot equation and massage it into an understandable format that I could then plug into a program to generate my own image of the Mandelbrot set.
Generating the Mandelbrot set is straight forward once you understand what the Mandelbrot set really is. The fractal depicts a grid of coordinates along the x and y axis that either fall into the set or not. The formula gets computed using the x and y position for the pixel in question, and then the resulting number get put back into the equation. The resulting number either gets larger or smaller. If it passes a certain threshold, then we decide it is not a part of the set, and move on. The resulting image is a bit map of numbers that are either part of the Mandelbrot set, or not. The fun gradients and colors, with which we are all familiar, represent how many times the calculation had to be performed before the number passed the threshold.
The Mandelbrot equation is as follows, where z_(n+1) is the value for which we are solving, (z_n)² is our accumulated value so far, and C is our complex coordinate.
z_(n+1) = (z_n)² + C
We are just focusing on the right side of the equation for now, because the left contains the values that we want to solve for. Let’s expand the right side of the equation with complex coordinates so we can simplify the answer.
= (x′ + y′ × i)² + x + y × i
The next step is to expand the accumulated value. We can use our old friend FOIL.
= x′² + 2(x′ × y′ × i) + (y′ × i)² + x + y × i
The i² simplifies down to -1, reducing the number of imaginary numbers to worry about.
= x′² + 2(x′ × y′ × i) – y′² + x + y × i
Next we will move all the components with an imaginary number (i) to the right.
= (x′² + x – y′² )+( 2(x′ × y′ × i) + y × i)
Now we can the simplify by isolating the i.
= (x′² + x – y′²)+(2 × x′ × y′ + y) × i
Now the right side of the equation resembles a complex coordinate, which happens to be what we are solving for on the left.
x′′ + y′′ × i = …
So, each element of the left hand side of the equation can be solved with its counterpart element on the right.
x′′ = x′² + x – y²
y′′ = 2 × x′ × y′ + y
i = i
Since the i is equal to i, and remains independent from the rest of the variables, we can just ignore it.
Now, all we need to do is plug x and y to generate our new x′′ and y′′, and then keep plugging in the new values until the numbers go out of bounds, or we reach our threshold.
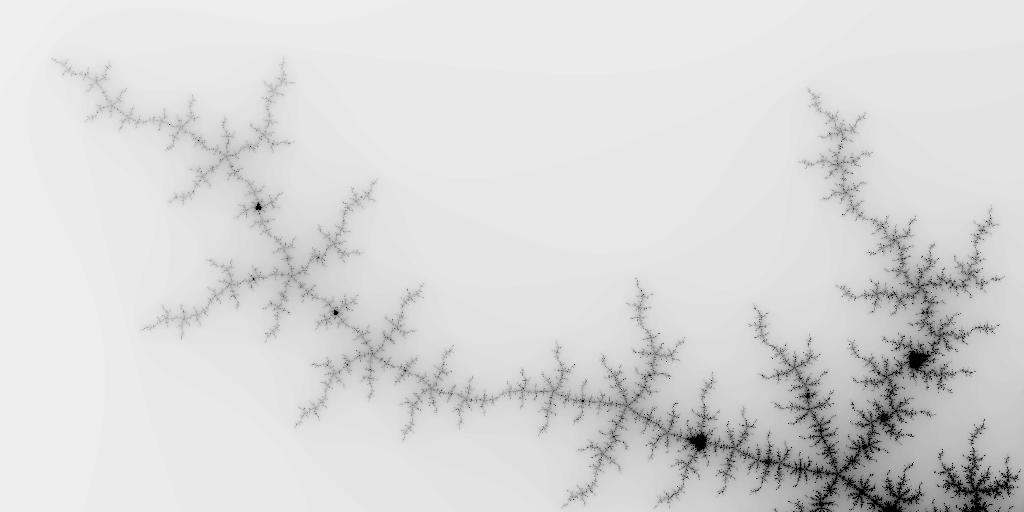
With the equation in hand, I started out by prototyping the program in Python, and outputting a Portable PixelMap (PPM) file because it is a dead-simple file format. When I first ran the program, it generated this image:

I was really disappointed that I didn’t get a meaningful image the first time I ran it. I verified the equation I was using, and the basic logic of the code, but it still came out like this. I kicked up the threshold a little bit to see what would happen, and suddenly I realized what the problem was. I was only rendering the upper left quadrant of the image. I finagled the bounds of the image, and ended up with the recognizable shape here:
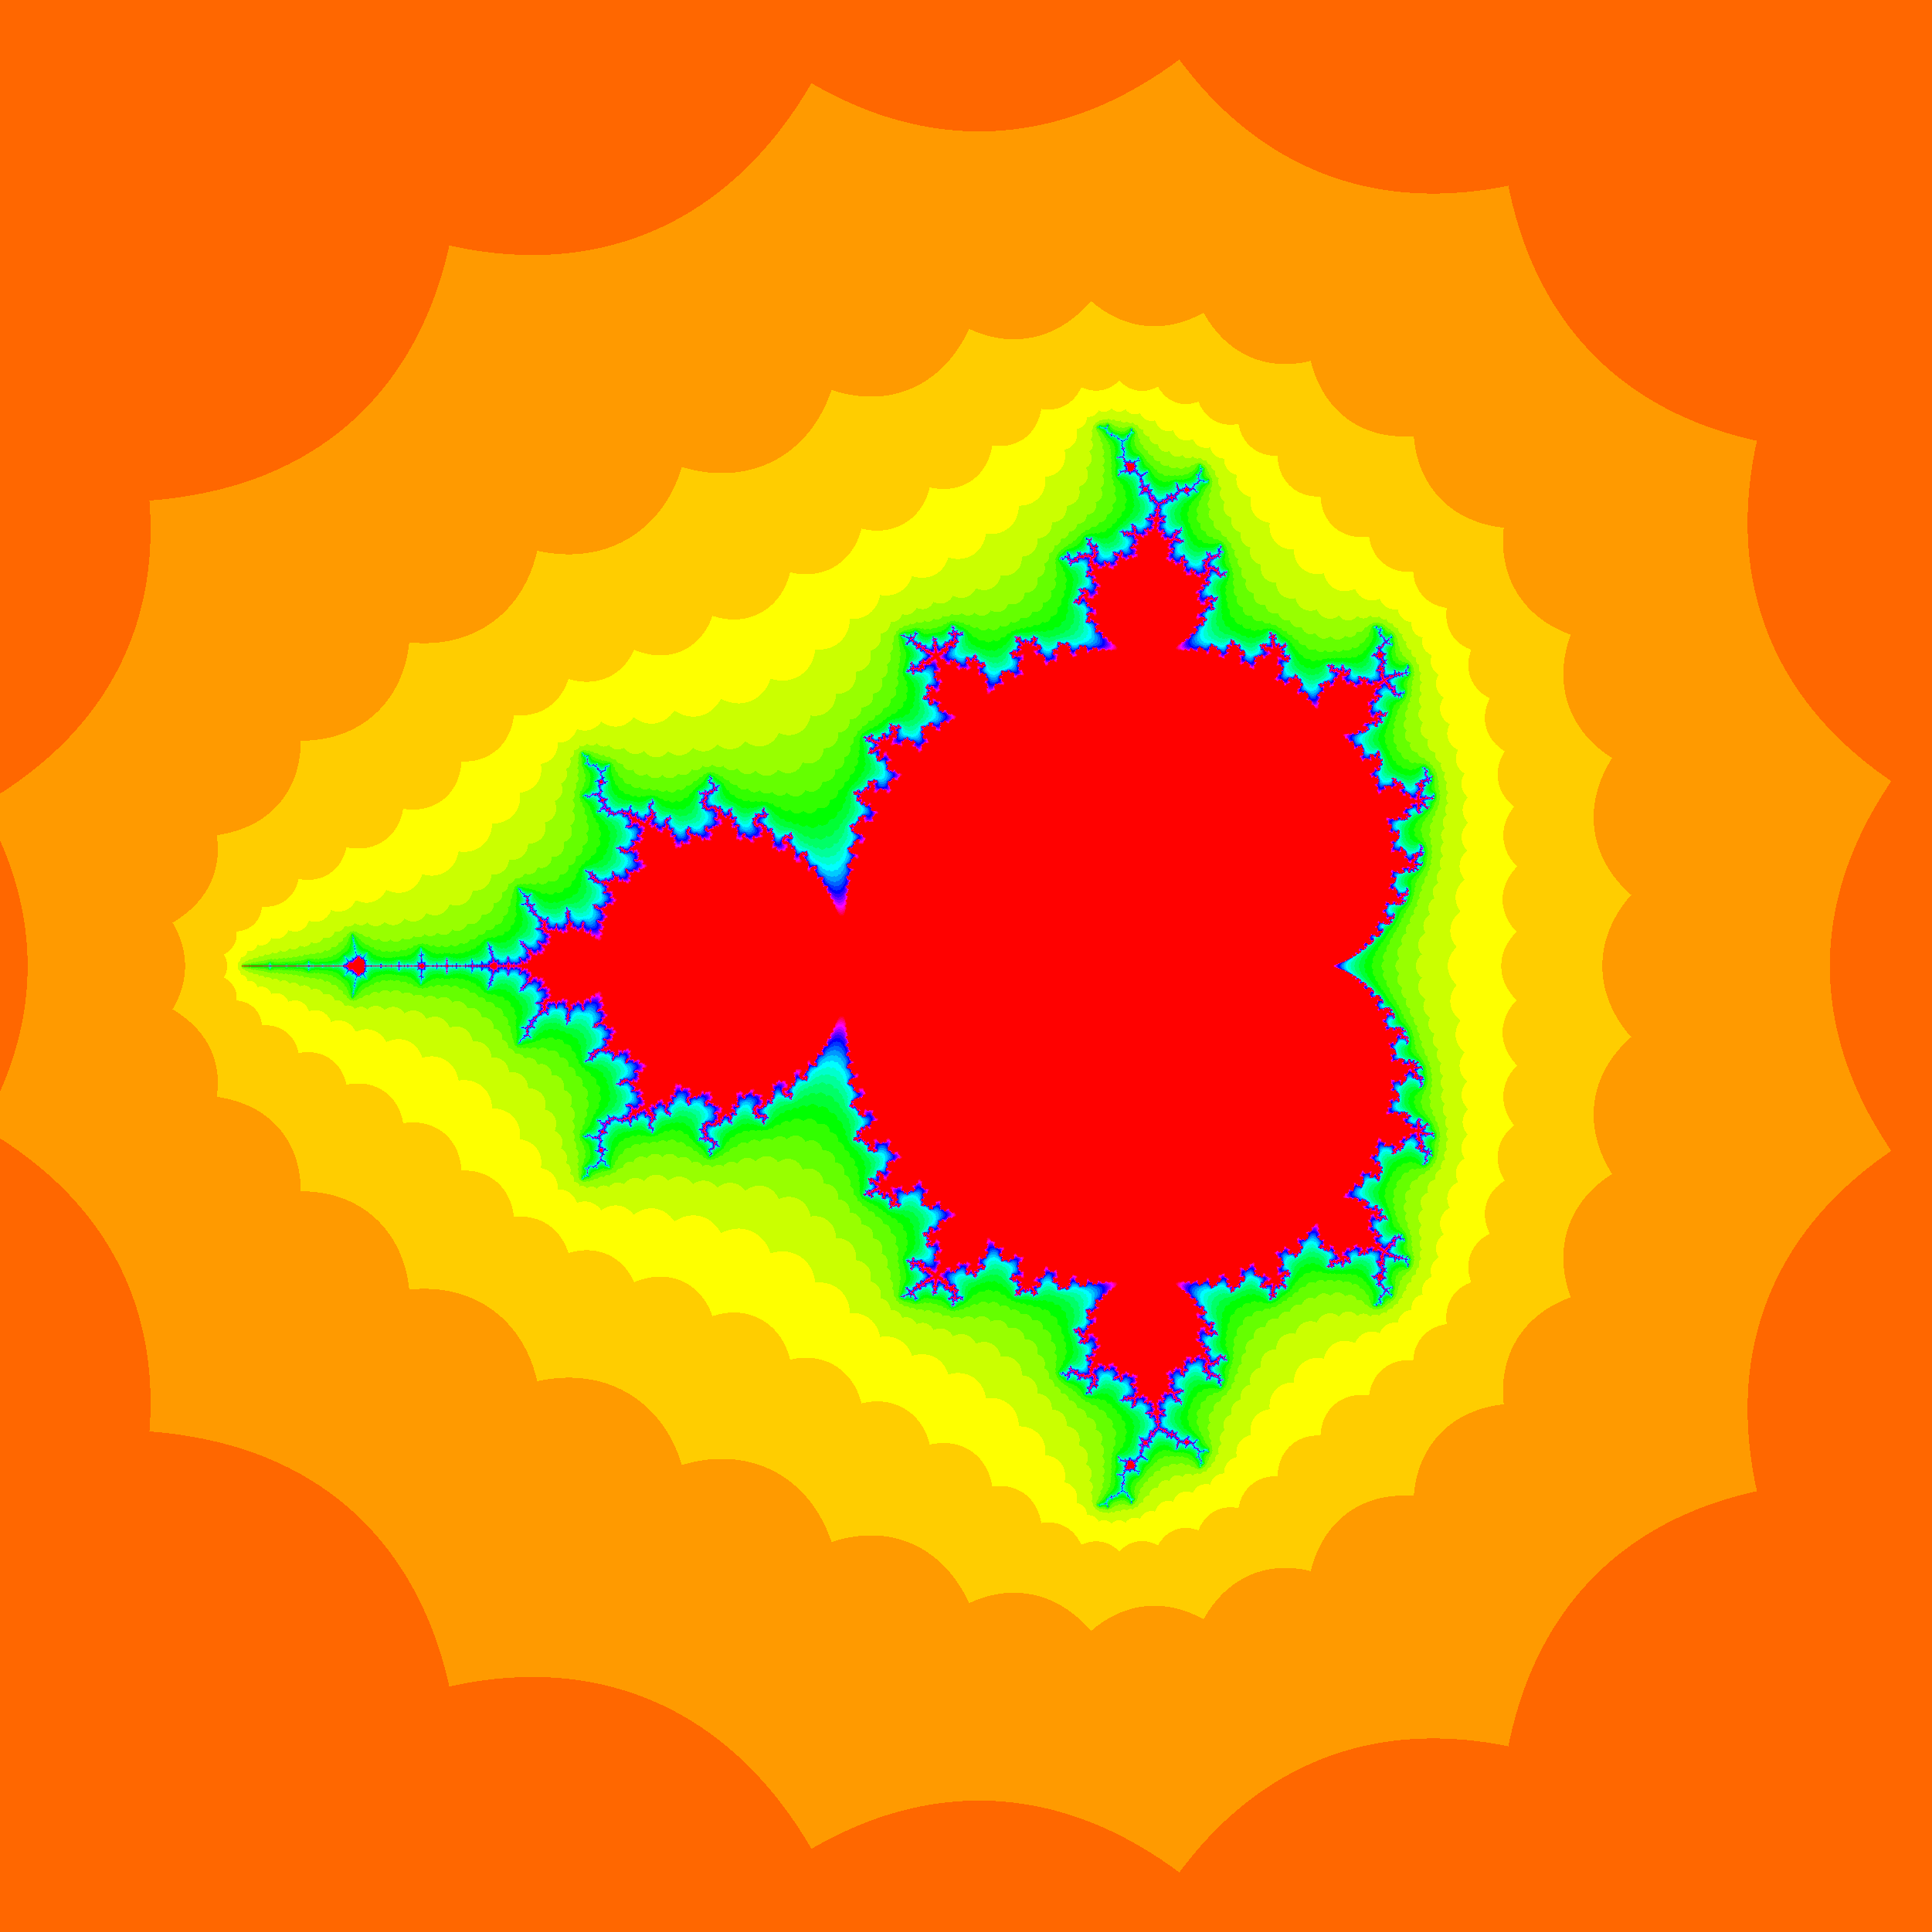
This certainly looked better, but something was still off. In all the Mandelbrot images I had seen, the different threshold levels looked smooth and curved, not jagged like mine were looking. It turned out I had misunderstood how to check if the calculation was out-of-bounds. This code is the culprit:
if (abs(xT) + abs(yT)) > 10:
This is the conditional statement that decides whether the number has fallen out-of-bounds. The key is to check if the number has left the circular area that contains the entire Mandelbrot set, which has a radius of 2. This would mean that the enclosing circle is something like x′′² + y′′² = 2². The corrected out-of-bounds check looks like this:
if ((xT**2) + (yT**2)) > 4:
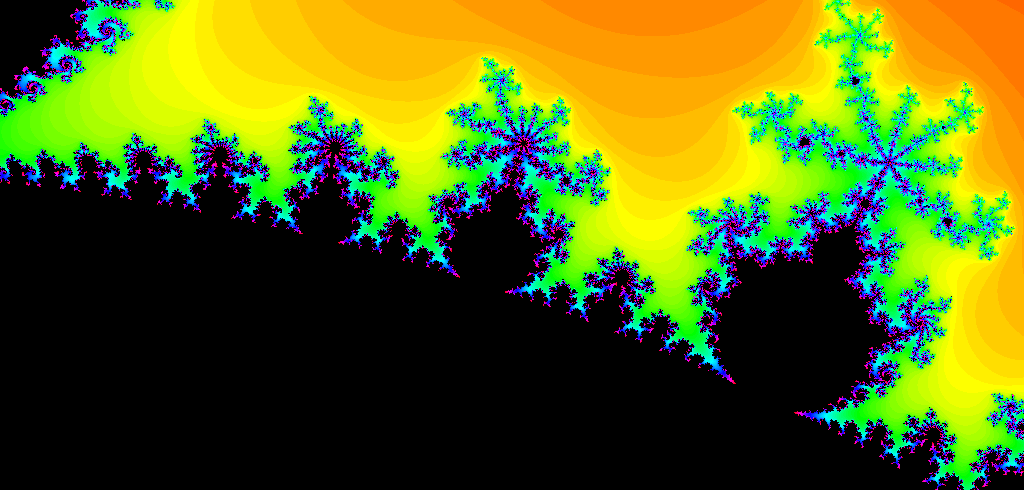
With that change, the images started coming out beautifully. With that, I started adding in command line options to set the bounds of the image, the depth, the gradient colors, etc. in order to easily render custom images of the set.
Now that I did it all in Python, I decided I should do it in C. Rendering 1024 pixel square image in Python takes about 15 seconds. To compare, rendering the same image in C takes .1 seconds; substantially faster!
The following code from my function, mandel(), calculates whether any given point is in the Mandelbrot set. The function takes an x and a y coordinate, and the threshold level which I call “depth”. It returns a -1 if the number is in the set, or it will return an integer representing the number of iterations it took for the point to become out-of-bounds.
int mandel(double x, double y, int depth)
{
    double xP=0, yP=0; // Prime Values
    double xT=0, yT=0; // Temporary Values
    int i=0;
    for (i=0; i<depth; i++)
    {
        xT = (pow(xP, 2)) + x - (pow(yP, 2));
        yT = 2 * xP * yP + y;
        if (pow(fabs(xT),2) + pow(fabs(yT),2) > 4)
            return i;
        xP = xT;
        yP = yT;
    }
    return -1;
}
The current code for both the Python and C versions are available from my GitHub page.